Mission
- We are part of the Center for Integrated Space Weather Modeling (CISM), a National Science Foundation (NSF) Science and Technology Center (STC) program to develop complete Sun-Earth model
- We focus on modeling the magnetosphere (using the LFM), the Thermosphere and Ionosphere (using TIEGCM), and a coupled version of these codes, called CMIT.
News & Highlights
- See a list of recent publications and presentations.
- Science higlight posted to the NCAR website: The storms between Sun and Earth: Looking for more lead time on damaging space weather and the related publication in Science.
- TIEGCM version 1.94.1 was recently released
- CMIT version 2.1.4 is coming soon! See the CISM wiki for details
- CISM Summer School - July 18 - 29
- CISM All Hands Meeting (in Jackson, WY) - September 21-23 (hotel information)
- Various CISM models are available for runs on request at the CCMC: ENLIL, TIEGCM, LFM-MIX and in the near future, CMIT.
Scientific Highlights
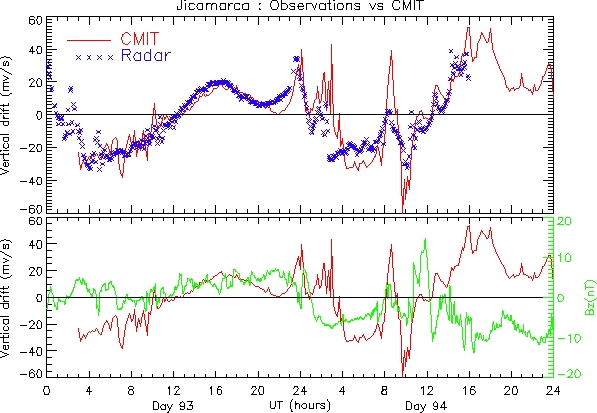 The top panel shows the modeled vertical drifts at Jicamarca (red line) and the ones observed by the Jicamarca ISR (blue crosses). The bottom panel shows the the same modeled vertical drifts (red line) and the IMF Bz value (green line). Both of these panels are for the 2nd and 3rd of April 2004. The first of these days was geomagnetically quiet; a geomagnetic storm occurred on the 3rd. The correlation with Bz suggests that the penetration of electric fields influence equatorial drift throughout the storm period. The model does a reasonable job of simulating the radar data. Click here for more information. |
Spotlight Movie
This movie shows Magnetosphere and Ionosphere parameters for a solar event in May 2005. Notice the auroral activity on May 15, 2005 @ 6:00 (about 13 seconds into the video). The Ionospheric electron density in the E-region is visualized first, with a transition to the F region electron density, followed by a transition to the F-region neutral temperature.
For more interesting graphics and animations, see the spotlight movies and